 Skip to main content
Data Visualizations of Covid-19 Activity & Statistics: Cases & Deaths
Updated 12/13/2020
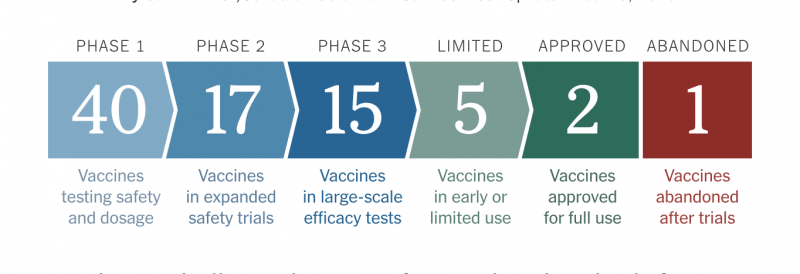
Many COVID-19 Vaccines in Trial
See the NYT Coronavirus Vaccine Tracker updates.
Google Location Data Trends from COVID-19
- To get the latest report, visit google.com/covid19/mobility
- The reports show trends over several weeks with the most recent data representing approximately 2-3 days ago—this is how long it takes to produce the reports.
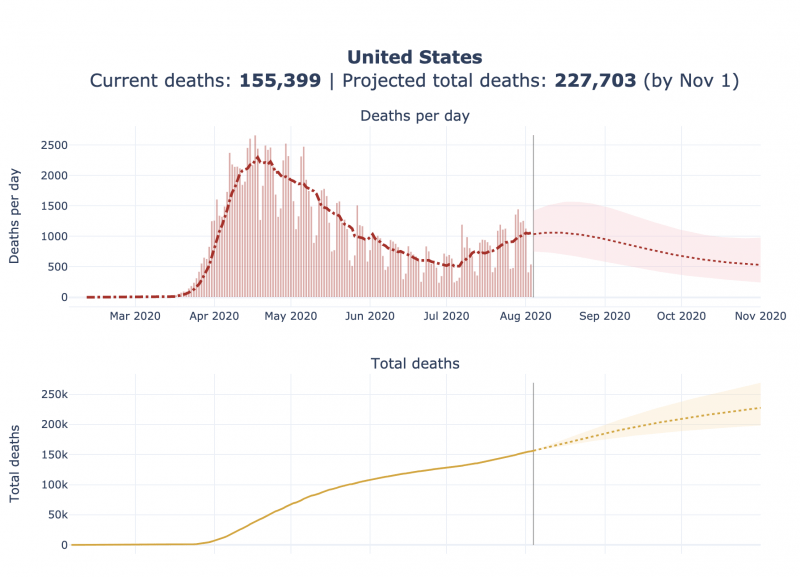
COVID-19 Projections
New York Times Article and Maps Showing Where People Stayed Home ... or Did Not
Click on NYT "Where America Didn't Stay Home Even as the Virus Spread"
Source: Canva
The company Canva is an online graphic design tool. They are offering a number of free graphics about how to protect you and your employees from COVID-19
Work From Home (WFH) Tips graphics: https://www.canva.com/design/DAD6MnObzTg/a97LFmX5Hx34X1z4uaRirg/edit
COVID-19 and general disease prevention tips: https://www.canva.com/design/DAD5h9AYMkE/C94Sdbf2e9nLZQ_0Q5b6Fw/edit
Source: Johns Hopkins University
Johns Hopkins COVID-19 World Map: https://coronavirus.jhu.edu/map.html
US Map (often quoted): https://coronavirus.jhu.edu/us-map
Source Centers for Disease Control (CDC)
CDC advice on COVID-19: https://www.cdc.gov/coronavirus/2019-nCov/index.html
Cases of Coronavirus Disease (COVID-19) in the U.S: https://www.cdc.gov/coronavirus/2019-ncov/cases-updates/cases-in-us.html
Guidance for Employers: https://www.cdc.gov/coronavirus/2019-ncov/community/guidance-business-response.html?CDC_AA_refVal=https%3A%2F%2Fwww.cdc.gov%2Fcoronavirus%2F2019-ncov%2Fspecific-groups%2Fguidance-business-response.html
Source: Google
Google COVID-19 Resources, main: https://www.google.com/covid19/
Google Community Mobility Reports, under the USA tab are tabs for all the states: https://www.google.com/covid19/mobility/
Source: Element AI
ELEMENT AI - Coronavirus Calculator :https://corona-calculator.herokuapp.com/
Reuters Story about Facebook Location Data to Assess Social Distancing
Rt.live and Systrom on Rt
https://rt.live/ These are values for Rt, a key measure of the rate of virus infection, growth or reduction. It represents the average number of people who become infected by an infectious person. If Rt is above 1.0, the virus will spread. When Rt is below 1.0, the virus will stop spreading.
The number to watch for COVID-19 infections: http://systrom.com/blog/the-metric-we-need-to-manage-covid-19/
World COVID-19 Stats & Survival Rate Calculator
This is a nice dashboard. The site was created by Avi Schiffmann; a highschooler in Washington State, USA in collaboration with Daniel Conlon.
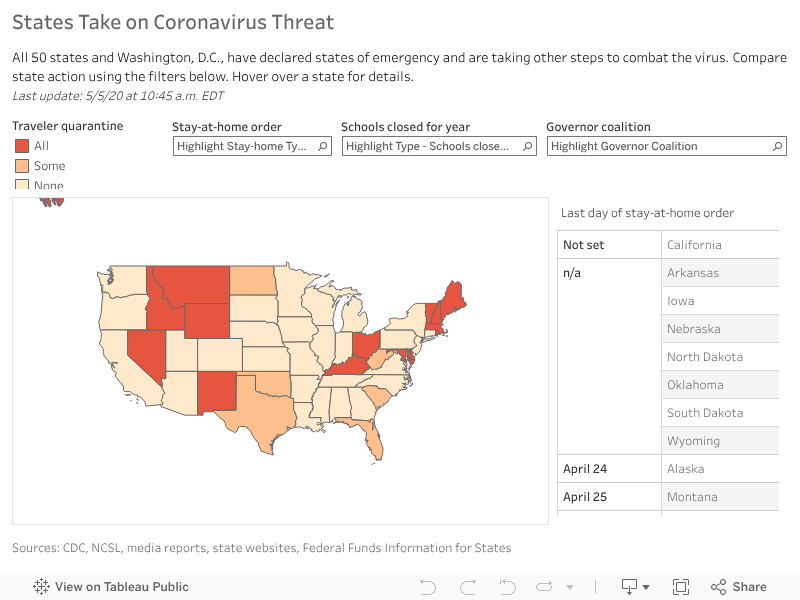
Source: Tableau
The map provides information on the lockdown status of the various states, which are under shelter-in-place orders and which have mandatory quarantine for arrivals from out-of-state.
Source: Flourish Total deaths worldwide. This animated chart shows how COVID-19 overtook all other causes of death over time.